Will it stop snowing?
Spring is just around the corner, and with that longer days and warming nights. This month, check out the latest tools focused on all things data journalism.
With the weather throwing wrenches at all the best laid plans, such as Professor Caesar Andrews’ plan to bring in LA Times Editor Kevin Merida and our Broadcast Survey pizza party, we carry on. Missed it, take a quick survey here.
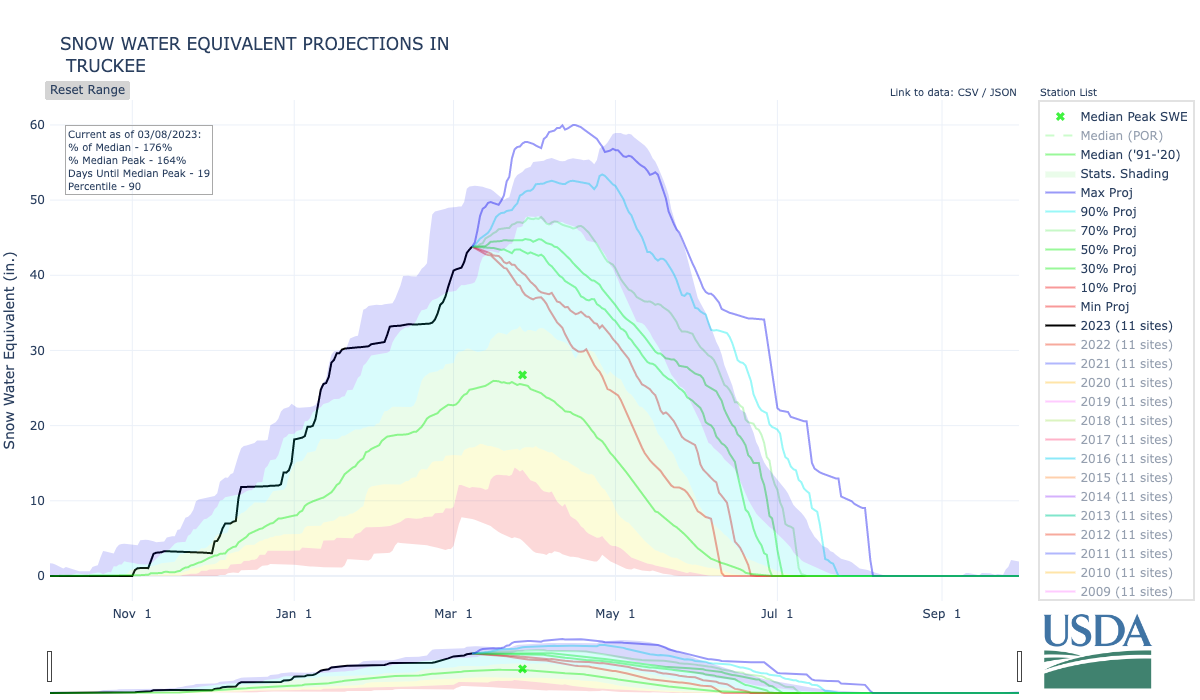
As yet another storm wraps up with another on deck, I am working a story about the current weather. With that, I have been parsing through a lot of data, trying to make sense of it.

In honor of the endless snow creating piles of data for researchers, this month features insight into using data for your storytelling.
Tool #1 - When Data Assumes a Male Population
Today is International Women’s Day, which began in in 1911, this Canva slidedeck highlights a male-centric assumption found across data and society. Originally presented as part of the National Institute for Computer-Assisted Reporting’s (NICAR23) annual conference, which just wrapped up in Nashville, Tenn.
This slide deck highlights how the world seems to automatically assume male for nearly everything. From automated translation translating ‘La profesora’ to male professor.
Once the issue is presented, the slides go on to present questions to ask as a reporter to dive into the nuances of research, studies, and data to determine if they were equal in gender breakdown. It is definitely worth a read.
Tool #2 - Data For Wildfire Investigations Tip sheet
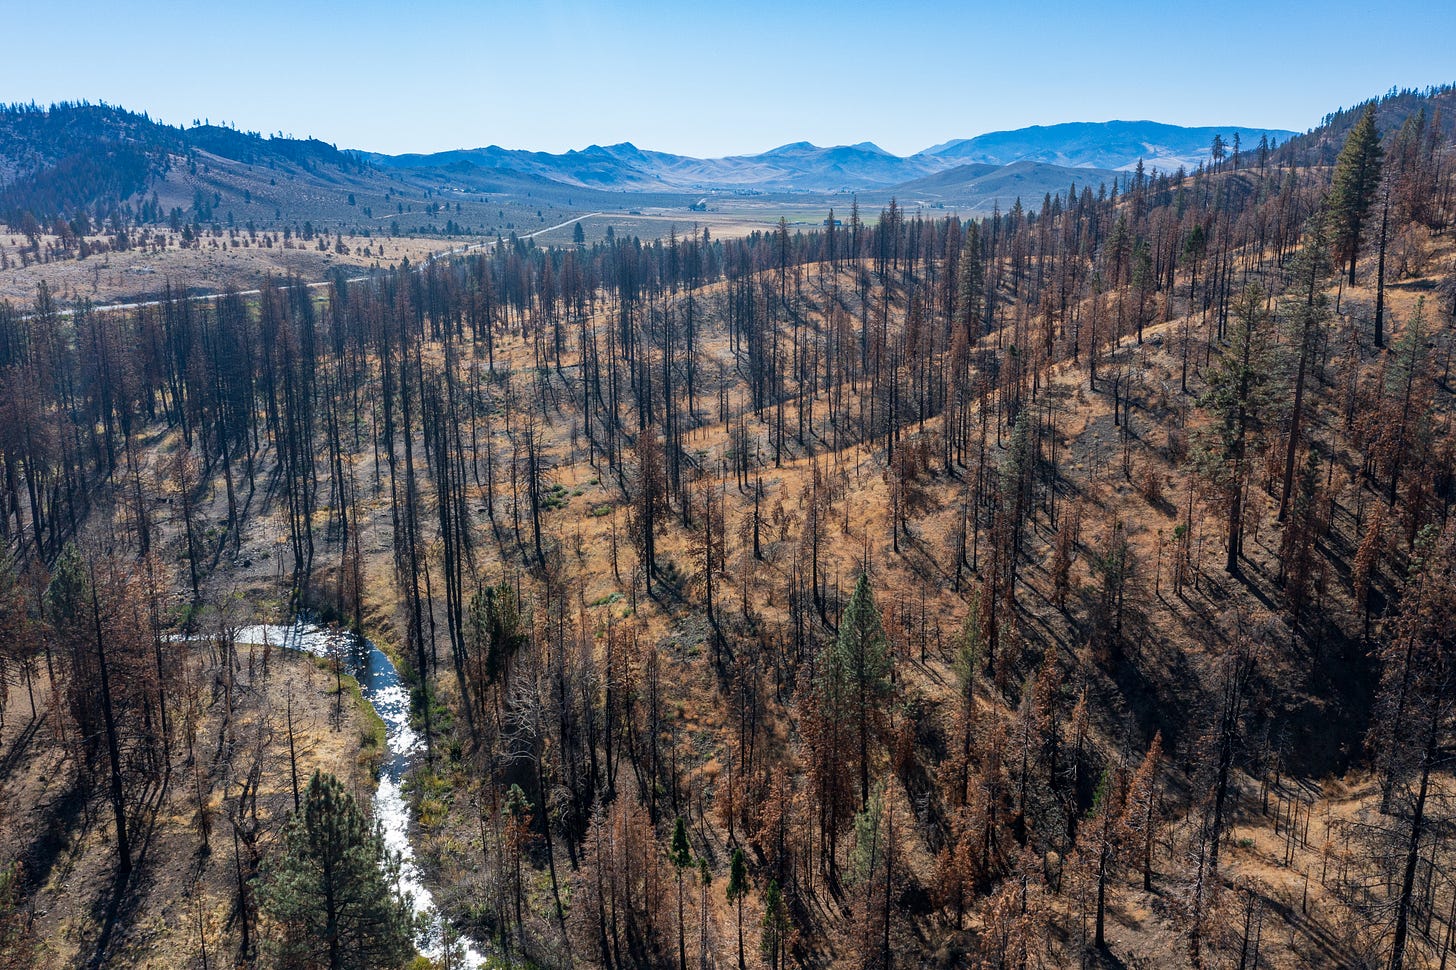
Currently it is snowing and wildfire is probably the last thing on many minds. For me, I am constantly looking at how to expand the wildfire narrative in the media beyond doom and gloom and acres burned. It is a nuanced story that deserves year-round coverage, especially in the arid west.
This tip sheet is a great starting point for any coverage of wildfires. Put together by Adiel Kaplan, Veronica Penney, and Emily Zentner, it features a ton of links, i.e. resources, for accurate and responsible reporting. What I like most is the section about mistakes to avoid.
If you plan to work in the West then this tip sheet is worth bookmarking, memorizing, and incorporating into your reporting and storytelling. I recommend creating a copy on your personal Google Drive, or better yet, download it, and referring back to it closer to fire season.
Tool #3 - The Accountability Project - Access to Public Records made Easier
This article explores how the Accountability Project was recently acquired by Public Integrity, Pulitzer Prize-winning nonprofit news organization (Hooray to nonprofit news and Pulitzer Prize Winning).
This tool will make data more accessible to journalists. Something that may come as a sigh of relief when we think about the FOIA process and how sometimes it drags on longer than this year’s winter.
This becomes another resource worth bookmarking if investigation reporting or public service journalism is your thing.
One thing to remember about data, it is a source in your storytelling. So treat it like one and be certain is viable, accurate, and reliable. This checklist, also from NICAR23, will help you track a source (data included).
For now, that is all I have. As the weather flows towards warmer temperatures and rain, stay safe.
Best
Richard Bednarski


